Big Data Visualization for Cologne: An Overview

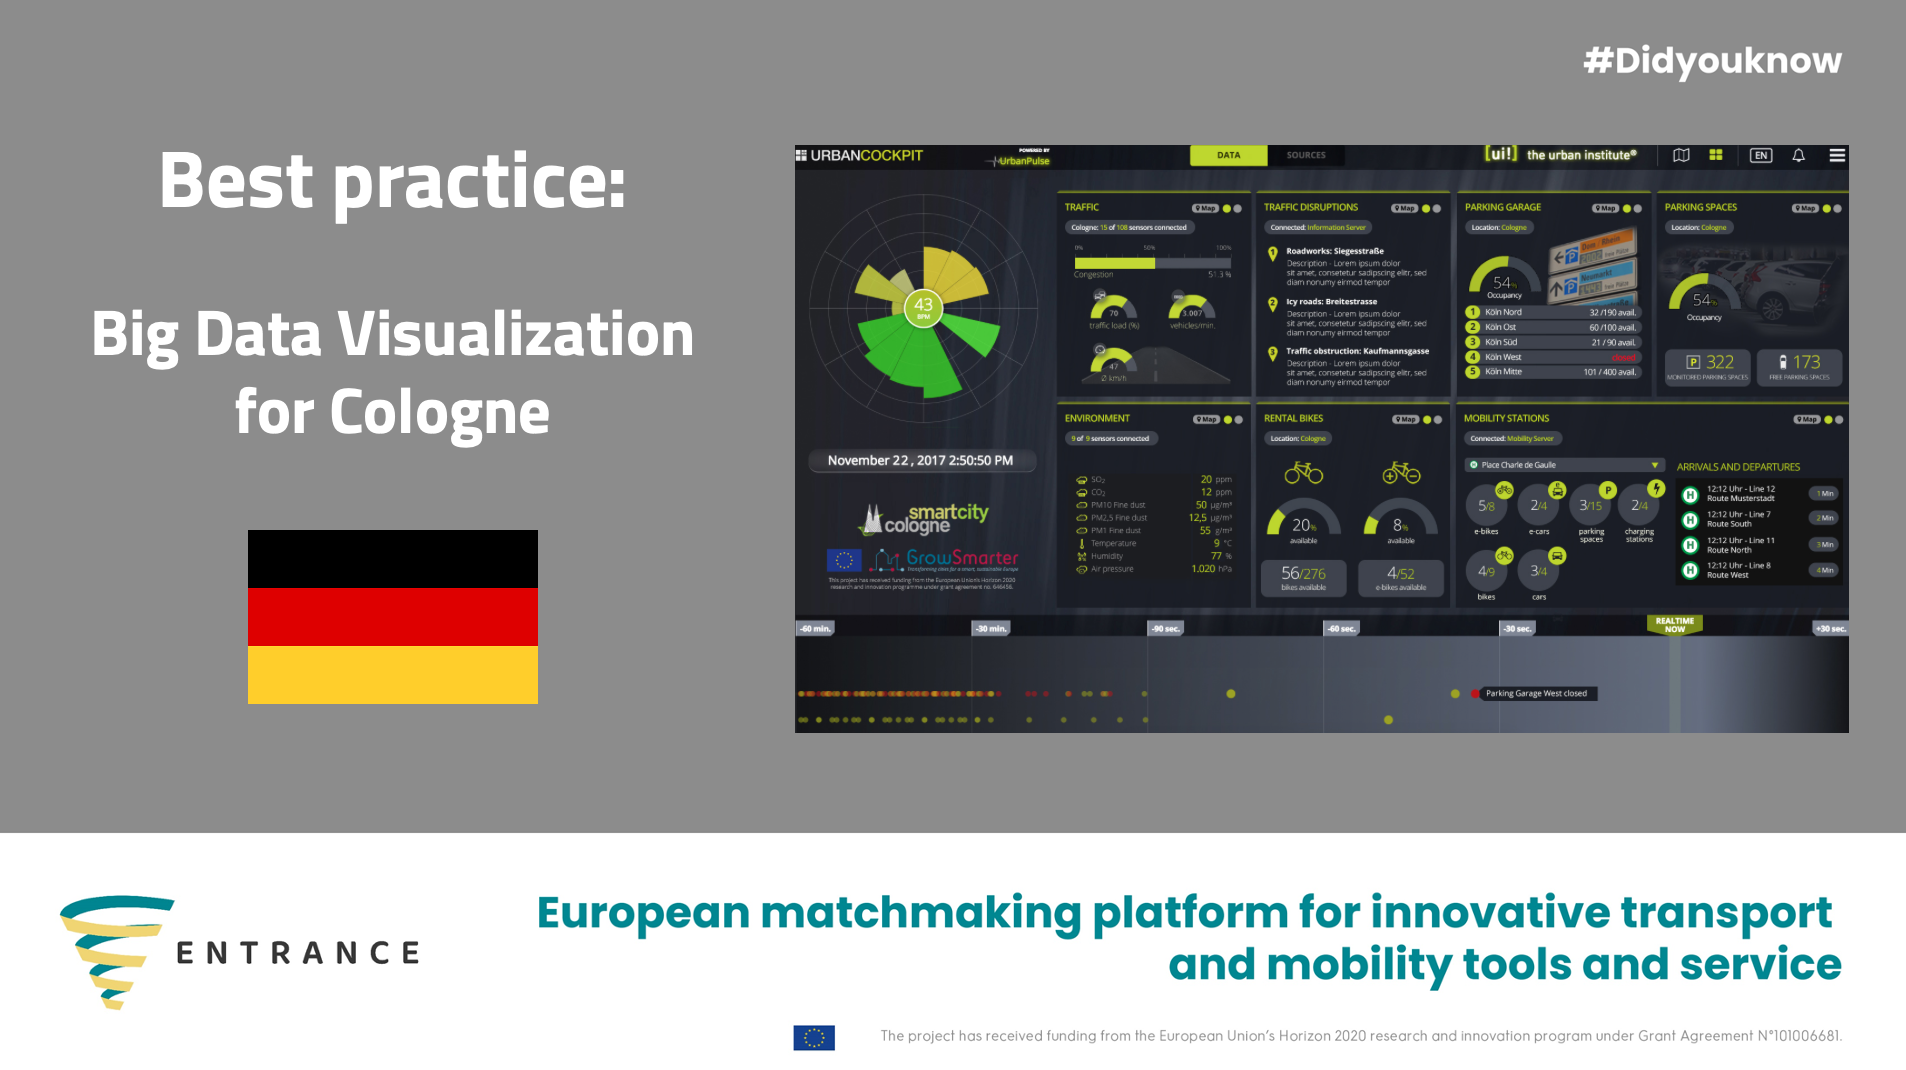
In the age of digitalization and data-driven decision making, the city of Cologne, Germany, steps up its commitment to integrate data to drive its urban development by implementing an innovative Big Data Management Application: The Urban Cockpit.
The Urban Cockpit is specifically designed to provide quick and accessible overviews of data curated from a myriad of sources inclusive of traffic management systems, energy providers, and several other companies. These data are neatly accumulated in a centralized Urban Data Platform on a city-wide scale.
THE CHALLENGE OF URBAN BIG DATA
Underpinning the implementation of this tool is a significant challenge – the mammoth volume of data generated within the city. With the explosion of data generation, a window has opened to process, analyze, and harness this information for the public good.
Analyzing the existing data, predicting future trends, and promoting a user-friendly way of visualizing open data could play a fundamental role in aiding well-informed decision-making processes across multiple tiers.
CHOOSING THE URBAN COCKPIT
The Urban Cockpit, an innovative solution from the Urban Institute, was handpicked to tackle the challenge of managing Cologne’s Big Data. Not only does it provide a swift and straightforward overview of the current urban scenario regarding traffic, energy, and the environment, but it is also publicly available online for citizens to access and utilize.
URBAN COCKPIT LAYOUT
The “pulse” of the city, a consolidation of several indicators, is available on the left-hand side of the Urban Cockpit. Updated every few seconds, these indicators can be custom-tailored according to the data available. For instance, favorable key performance indicators (KPIs) and values paint a green picture, whereas unfavorable or deteriorating conditions lead to a yellow or red display, indicating that the city’s state is stressed.
The right-hand side of the Urban Cockpit offers a more detailed insight into various aspects of the city’s current condition. This includes information regarding the availability of parking spaces, the number of cars being shared, the current usage of public transport, and so on.
HARNESSING REAL-TIME DATA
All data from the Urban Cockpit are processed in real-time to generate value-added insights. This data is then stored to fuel further data analytics, with KPIs visually demonstrating the city’s current condition. For example, red alerts would signal very high pollution levels or a very low share of renewable energy.
CITIZEN PARTICIPATION
To maintain a transparent and open line of communication with its citizens, the Urban Institute held public meetings and showcased the dashboards to keep them informed and seek their feedback. This interactive approach emphasizes the democratic aspect of the initiative, promoting citizens’ active participation in urban governance.
In conclusion, through the cutting-edge Urban Cockpit application, the city of Cologne demonstrates an assertive stance on leveraging big data for urban development. With the citizen-centric design and real-time data processing, the initiative is a step forward into the era of smart cities.